- All the Money in the World
- How Much the World is Worth
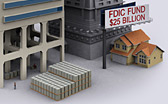
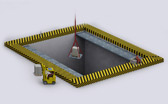
- The Flow of Money During Financial Crisis
- Net Worth of World's Richest People
- Net Worth of World's Biggest Companies
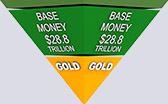
- The Liquidity Pyramid a.k.a. Exter's Inverted Pyramid
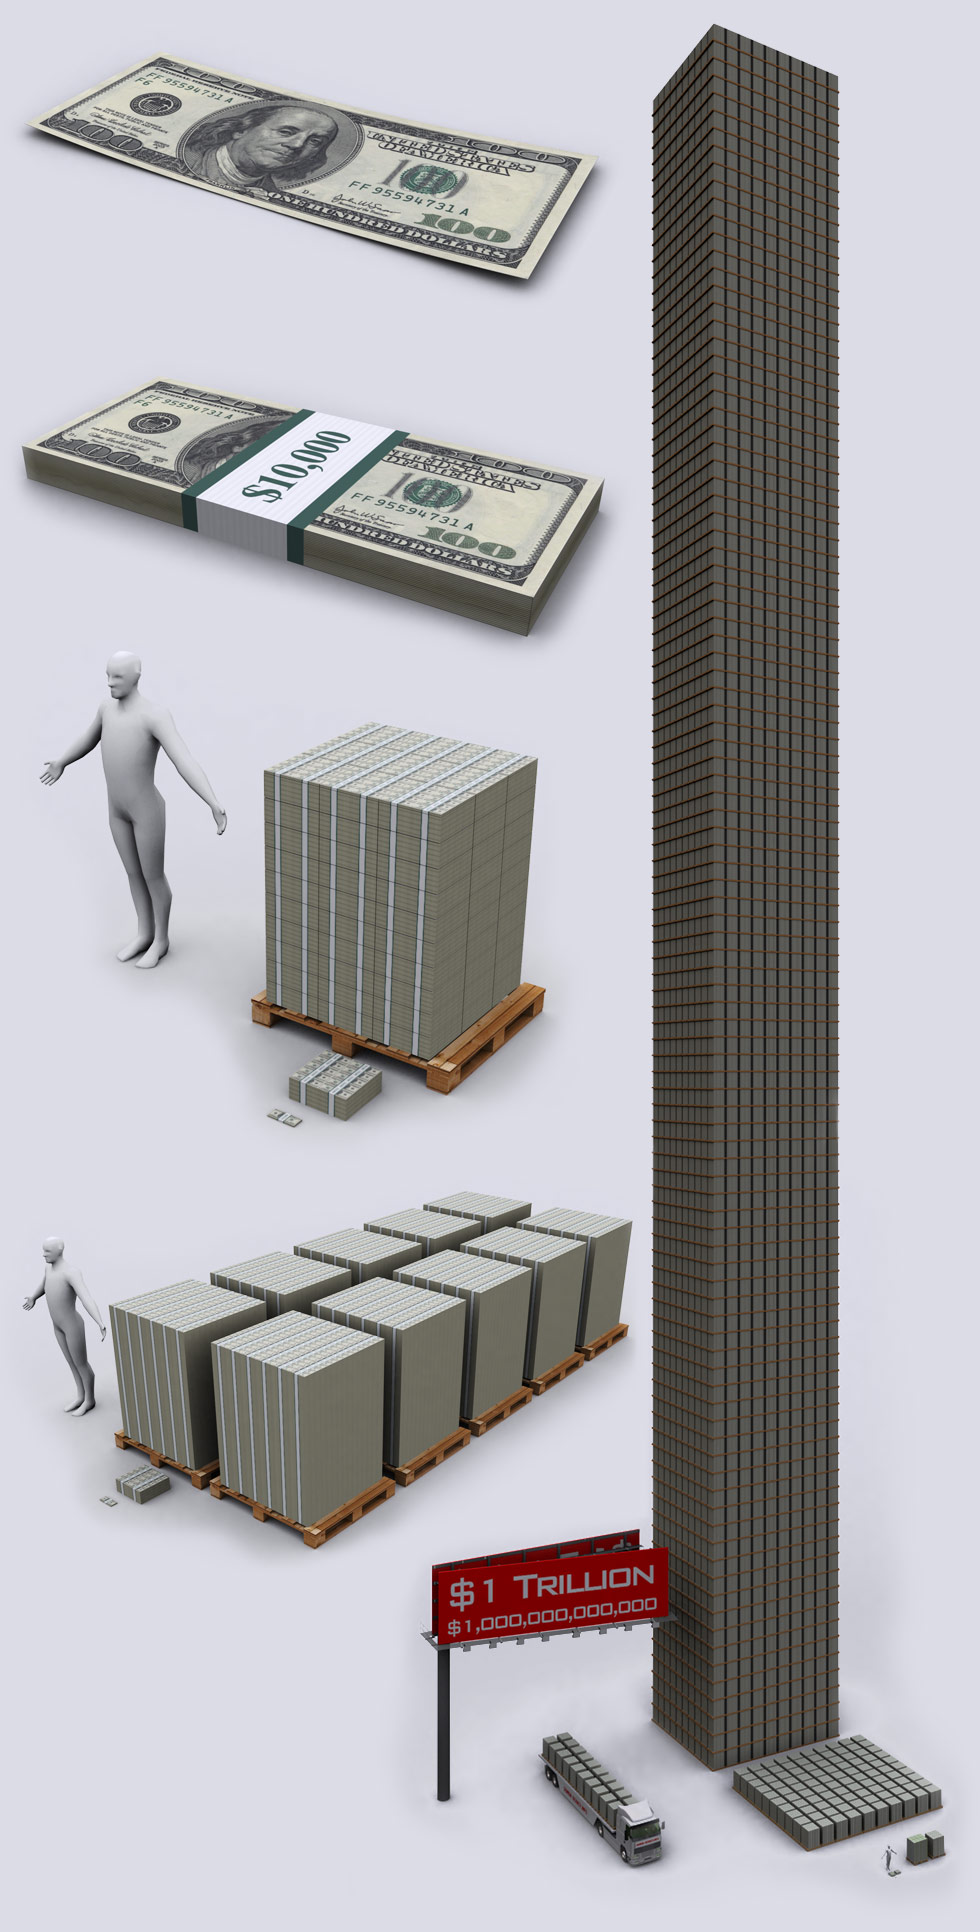
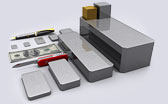
| One Hundred Dollars |
| $100 - Most counterfeited money denomination in the world. The most widely used storage of value in the world for drug dealers. Keeps the world moving. |
| Ten Thousand Dollars |
| $10,000 - Enough for a great vacation or to buy a used car. Approximately one year of work for the average human on earth. |
| 100 Million Dollars |
$100,000,000 - Plenty to go around for |
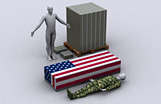
| 1 Billion Dollars |
$1,000,000,000 - This is how a billion dollars looks like. |
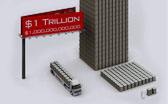
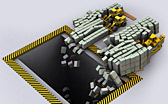
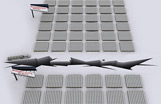
| 1 Trillion Dollars |
$1,000,000,000,000 - When they throw around the word "Trillion" like it is nothing, this is the reality of $1 trillion dollars. The square of pallets to the right is $10 billion dollars. 100x that and you have the tower of $1 trillion that is 465 feet tall (142 meters). |
|
|
||||
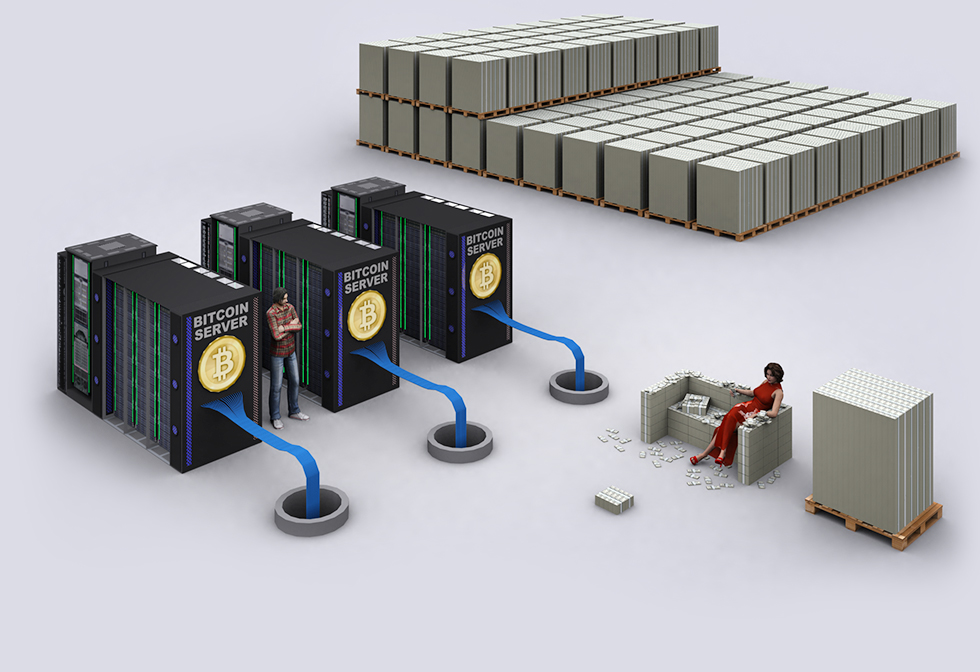
| Bitcoin - $14 Billion Market Cap in Jan 2017 | Asset Class: Cryptocurrency |
Bitcoin is an independent digital currency (just as digital as the money numbers in your bank account). The difference is that YOU have the control over this number, not the banks.
Bitcoin is NOT controlled by any government or any bank. It works on the same idea as BitTorrent, but instead of broadcasting files, transactions are broadcast to thousands of servers that check on each other to make sure the transactions are valid by means of advanced cryptographic algorithms. You also can run a Bitcoin node/server at your home. Why Bitcoin? Bitcoin can not be created out of thin air, unlike Dollars and Euros. Bitcoin follows the laws of thermodynamics- Bitcoin requires input (computer tech investment and electricity) to create/mine Bitcoins, just like Gold requires equipment and fuel for mining/extraction. Bitcoin is finite, with only 21 million coins that will ever be created. Bitcoin is deflationary versus Dollars and Euros that are inflationary. You have total control of your funds,you can transfer it globally near instantaneous speed with immutability- something neither Dollar, Gold or any other storage of wealth can offer. Long term outlook for Bitcoin is that it might do to Money what the Internet did to Communication. Potential Risks: Bitcoin was created by the mysterious figure Satoshi Nakamoto (pseudonym), the identity of the creator is still argued to this day. There are now many Cryptocurrencies like Bitcoin, still Bitcoin is most dominant. Bitcoin created an idea, but competing crypto currencies with better implementations could possibly overtake Bitcoin in the future, just like Facebook overtook MySpace. |
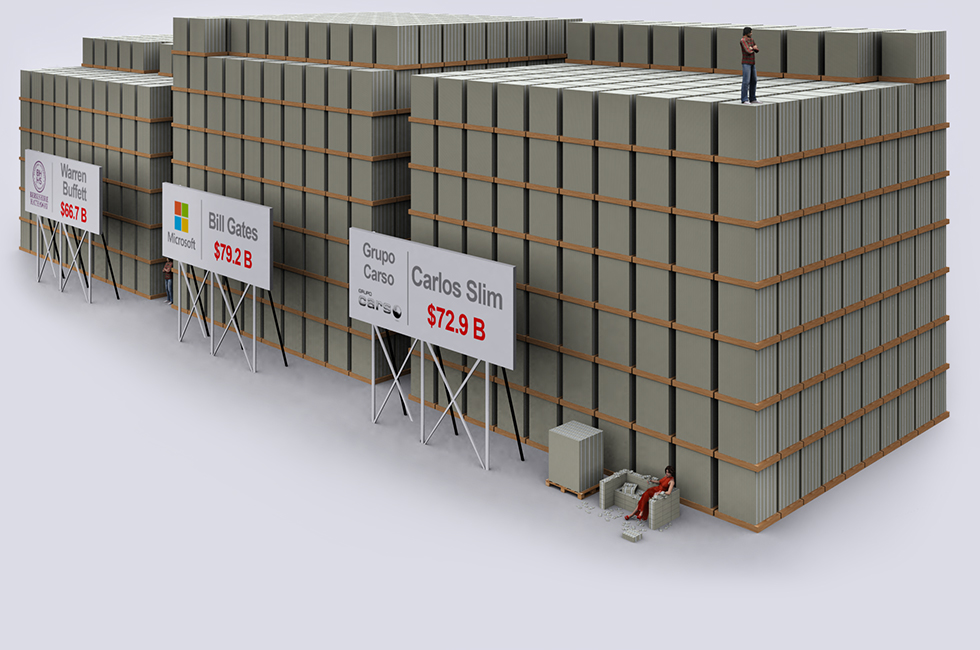
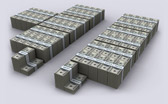
| World's Richest People |
Bill Gates, Carlos Slim and Warren Buffett are the richest people in the world, this is how their fortunes stack up in $100 bills. Bill Gates and Warren are US citizens. Carlos Slim is a Mexican citizen, being a successful investor throughout his life, Carlos now runs multiple monopolies in Mexico. If Bill Gates and Warren Buffet (US Citizens) both donated all their money to the US Government (at pay.gov) their collective wealth of 145.9 Billion would fund the US Government for 13 Days, 7 Hours, 31 Minutes and 17 Seconds, or if all paid in lump sum. Bill and Warren together could decrease the US Debt by 0.7 percent. If you are one of the so called "rich" and you were lucky enough to make a million dollars per year, it would take you almost 80,000 YEARS to catch up to Warren! Data time: Dec 2014. |
|
||||
|
||||
|
||||
|
||||
|
||||
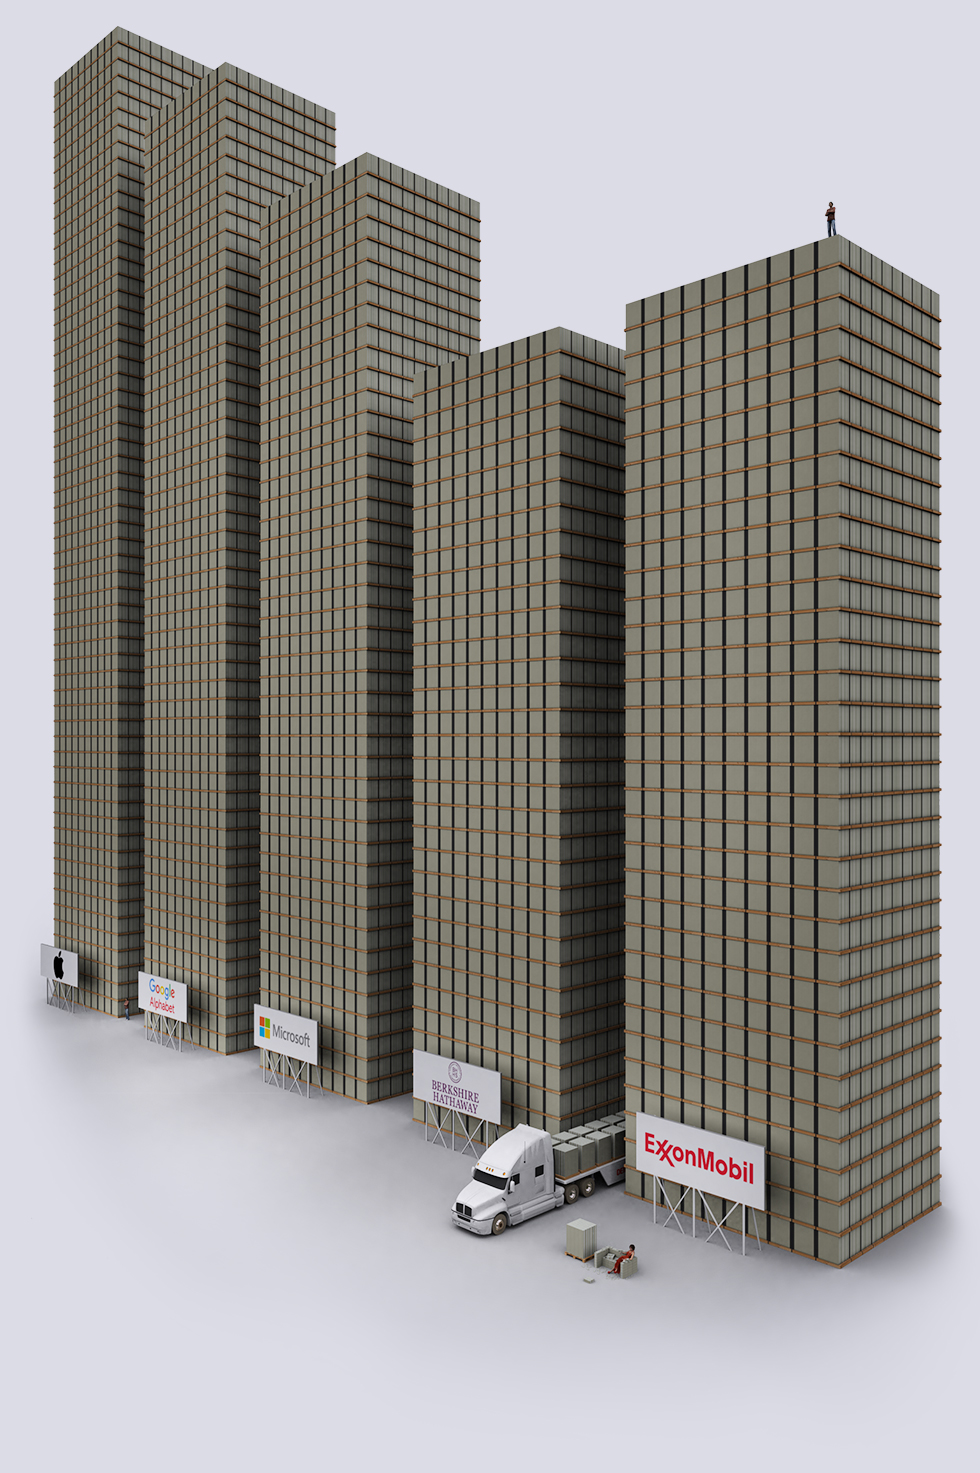
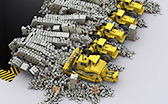
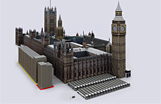
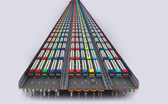
| World's Biggest Companies |
This shows the estimated value of the world's largest companies. The value shown is their stock's "Market Capitalization", which is calculated as share price multiplied by total number of shares. This number actually is abstract estimation of value and fluctuates greatly with bad or good news published on a company. It is not uncommon for a 10% move in Stock Prices and Market Cap. This means these towers of cash can sometimes fluctuate in height of 5-10 floors per day. Still the Market Cap is a rough sense of their size and perceived value.
|
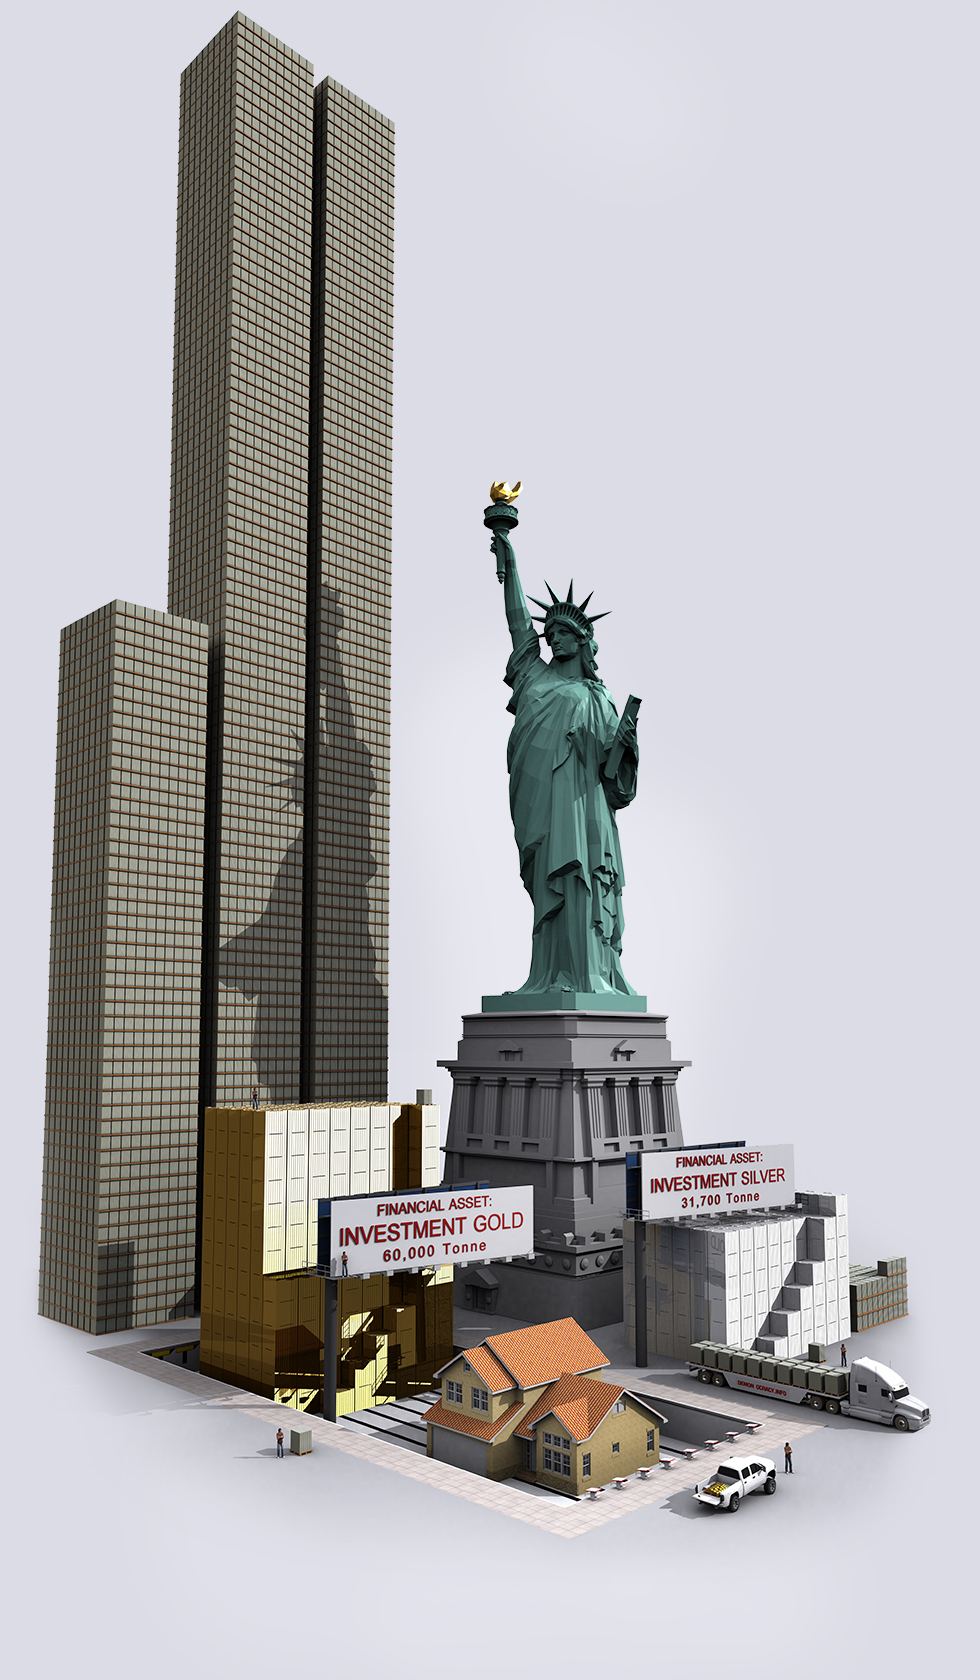
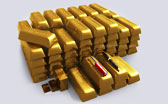
| All Investment Gold & Silver in the World |
Demonocacy.info has dedicated articles for all the Gold and all the Silver in the World. This is short summary of the relatively small amount of gold and silver available in the world for investment purposes. The approximate value of all investment Gold in the World is $2.5 Trillion
USD There is significantly more silver in the world than gold, but because silver is multiples cheaper than gold (less than $20/oz in 2017), a lot of silver has gotten lost throughout time. Silver is also used in industrial production. The amount of investment silver available to the public is a surprisingly small amount. World governments do not hold any significant silver reserves, unlike with gold. Data Source: Silver Institute & World Gold Council
|
|
||||
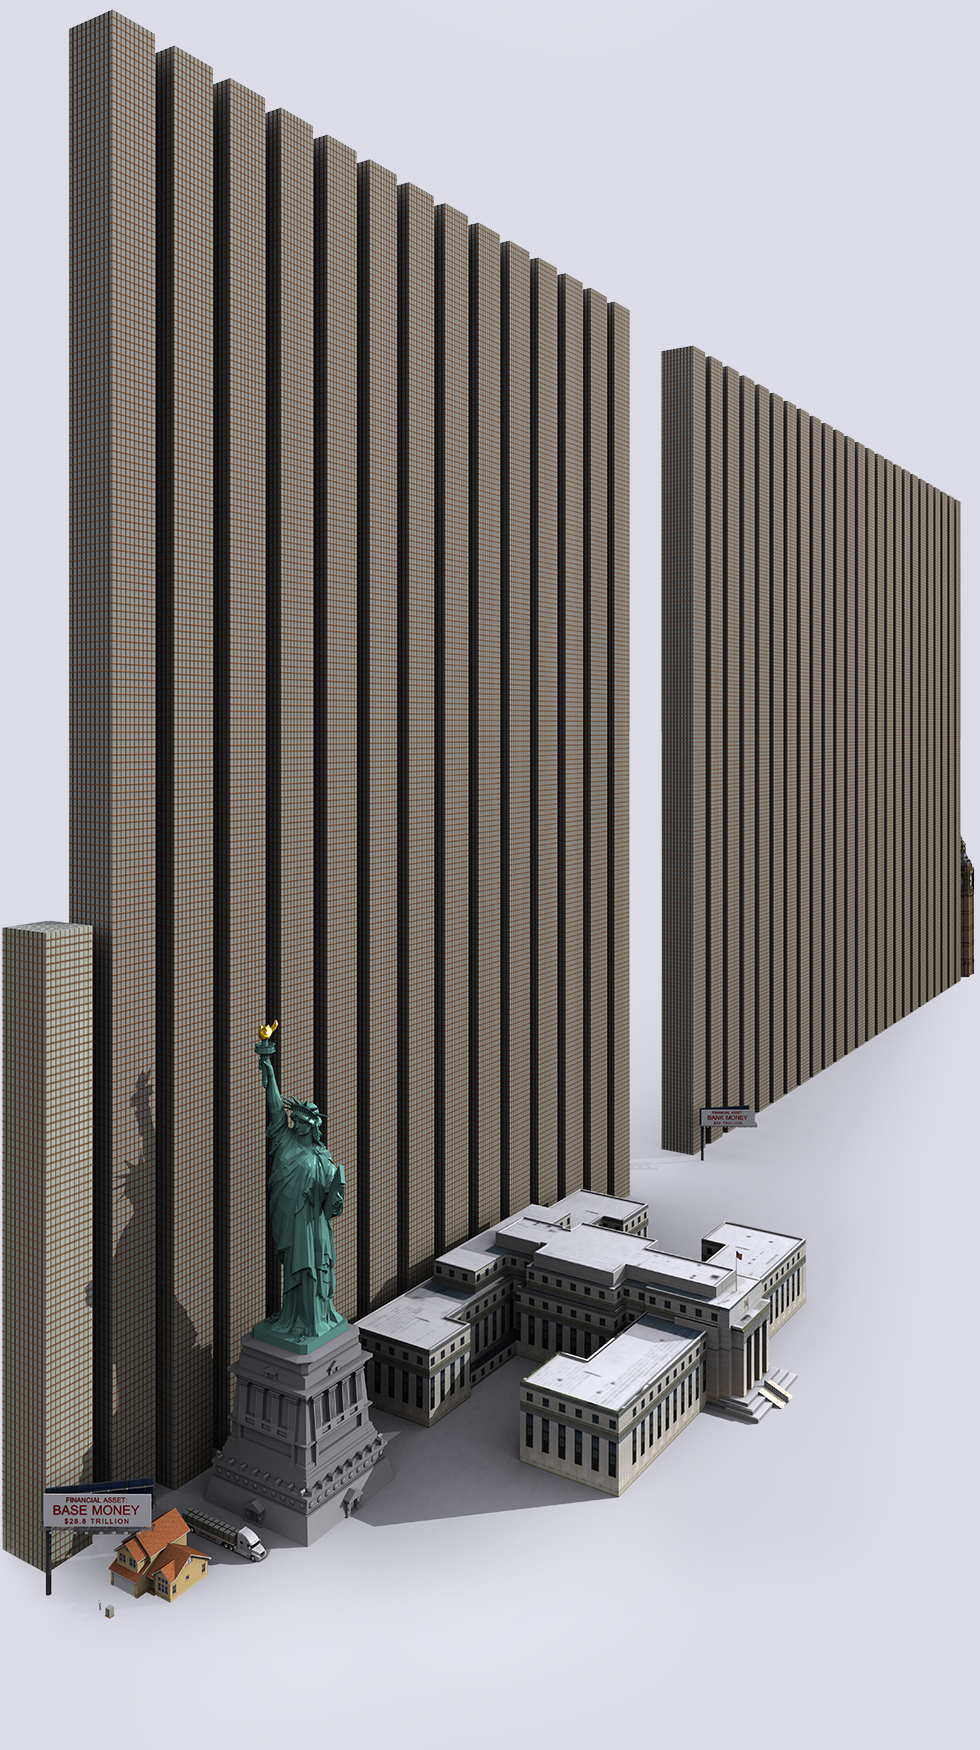
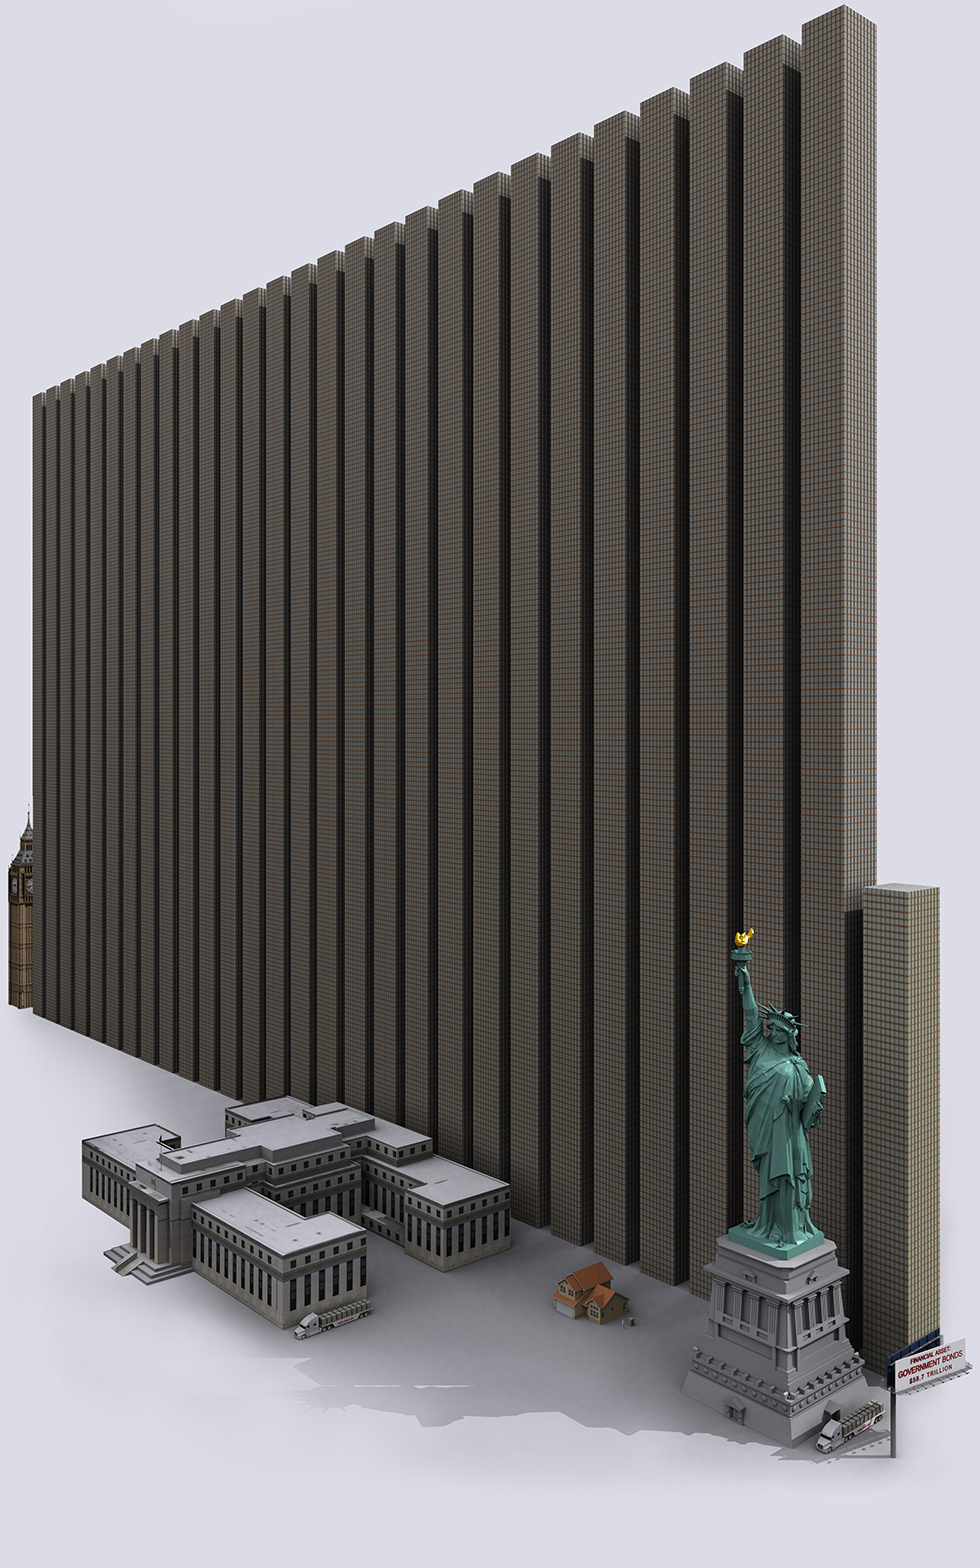
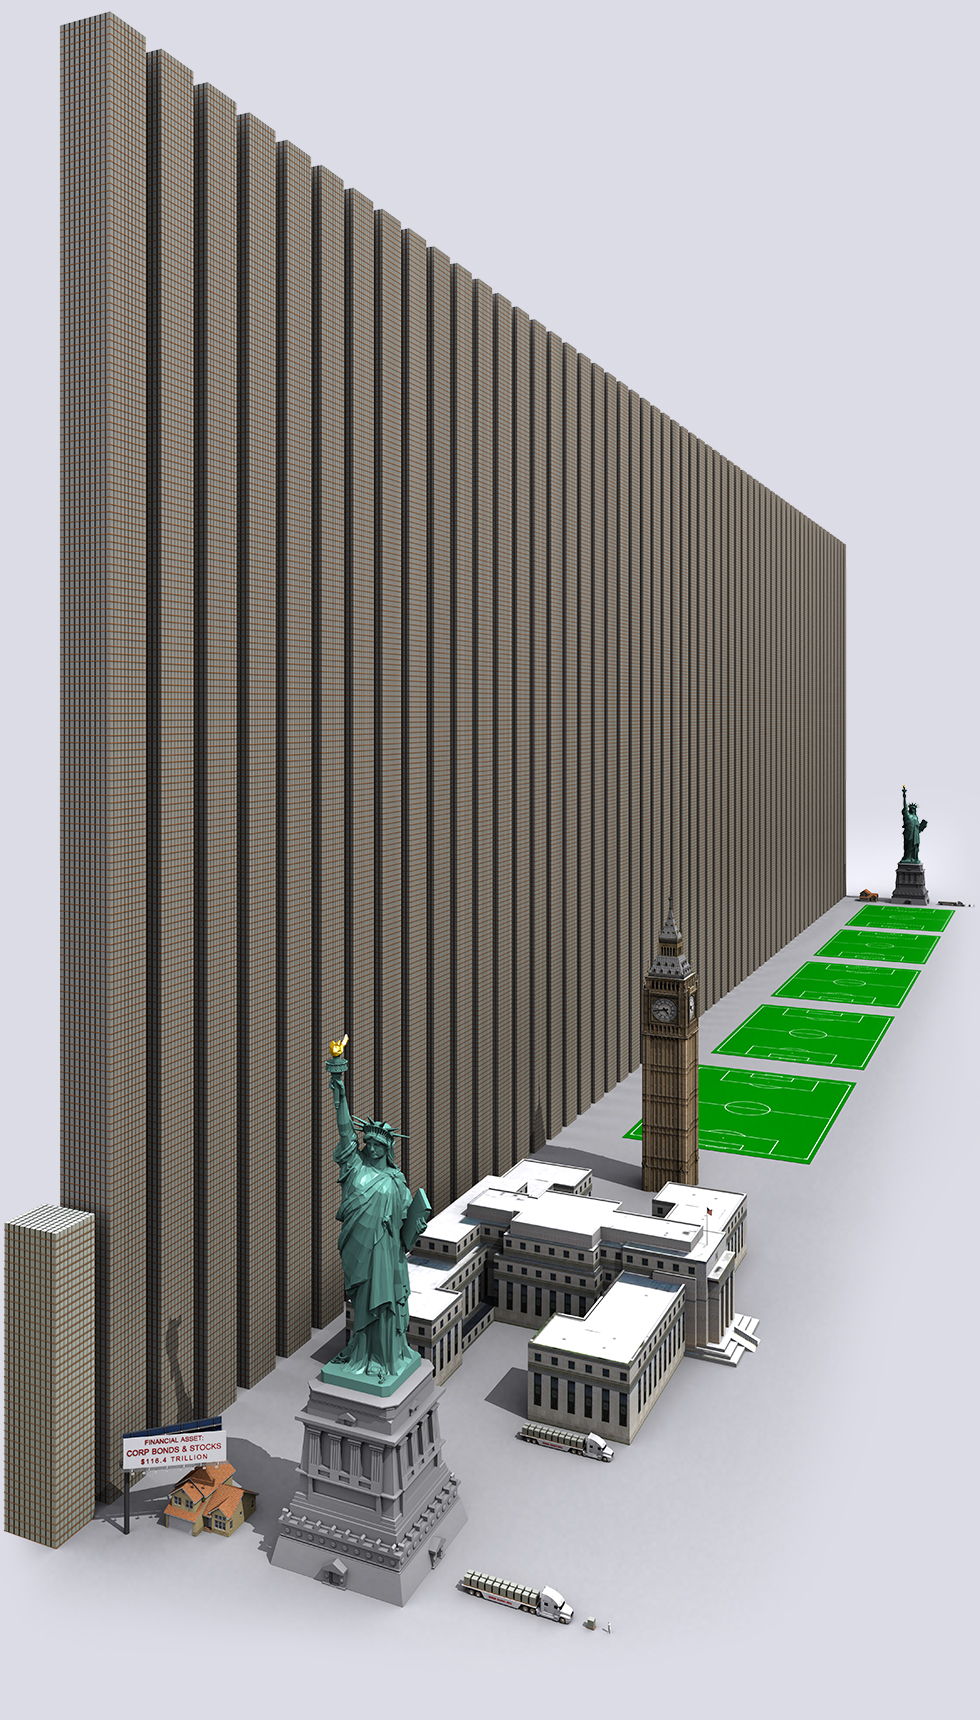
World Money Supply: |
This is how much money is on the planet. It is not all in physical cash though (as shown above), most of it is digital: |
|
||||
|
||||
|
|
||||
|
|
||||
|
|
||||
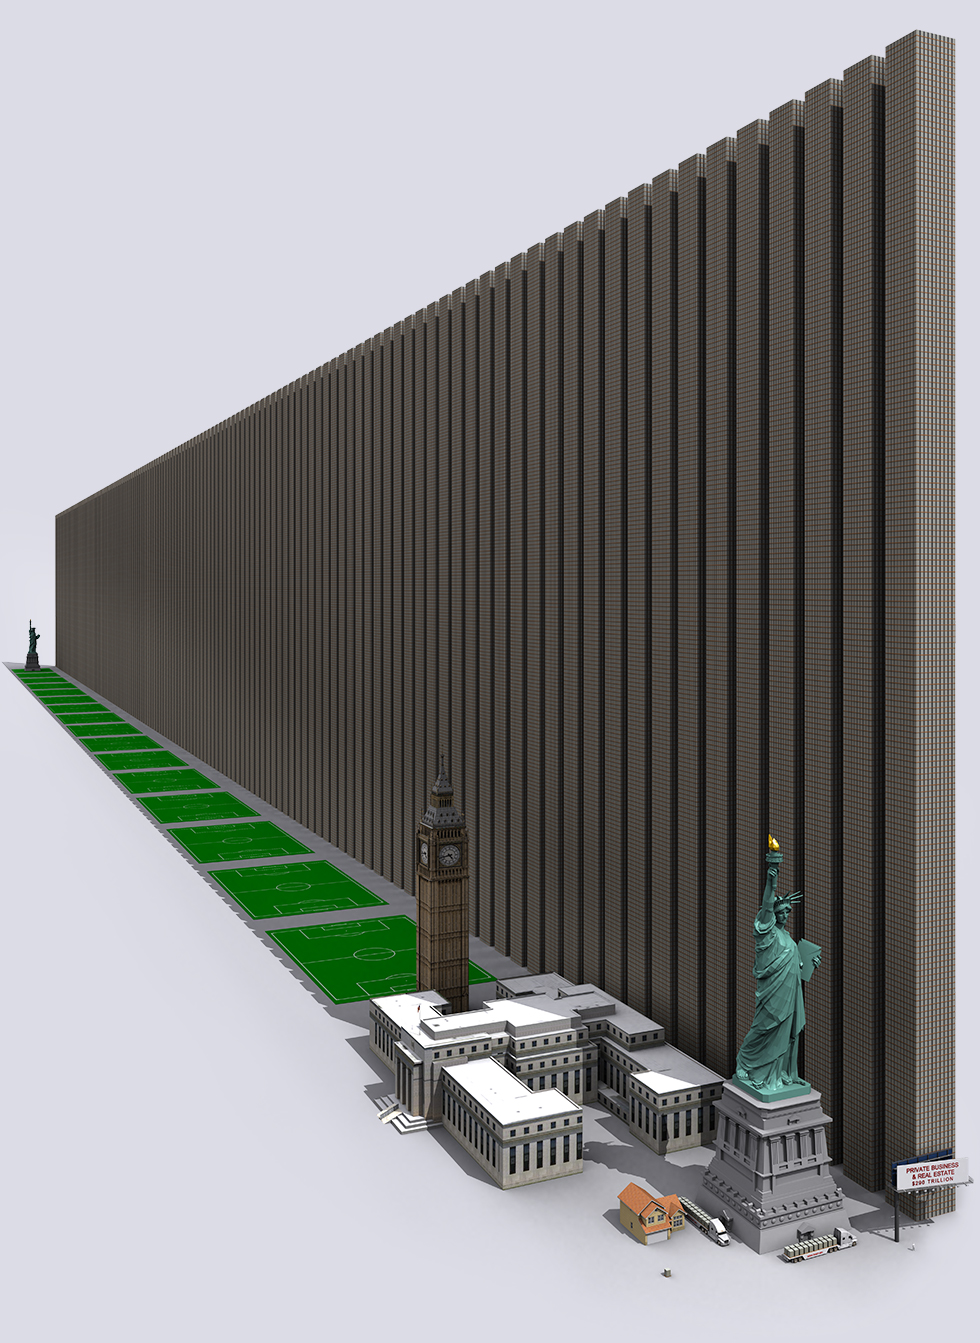
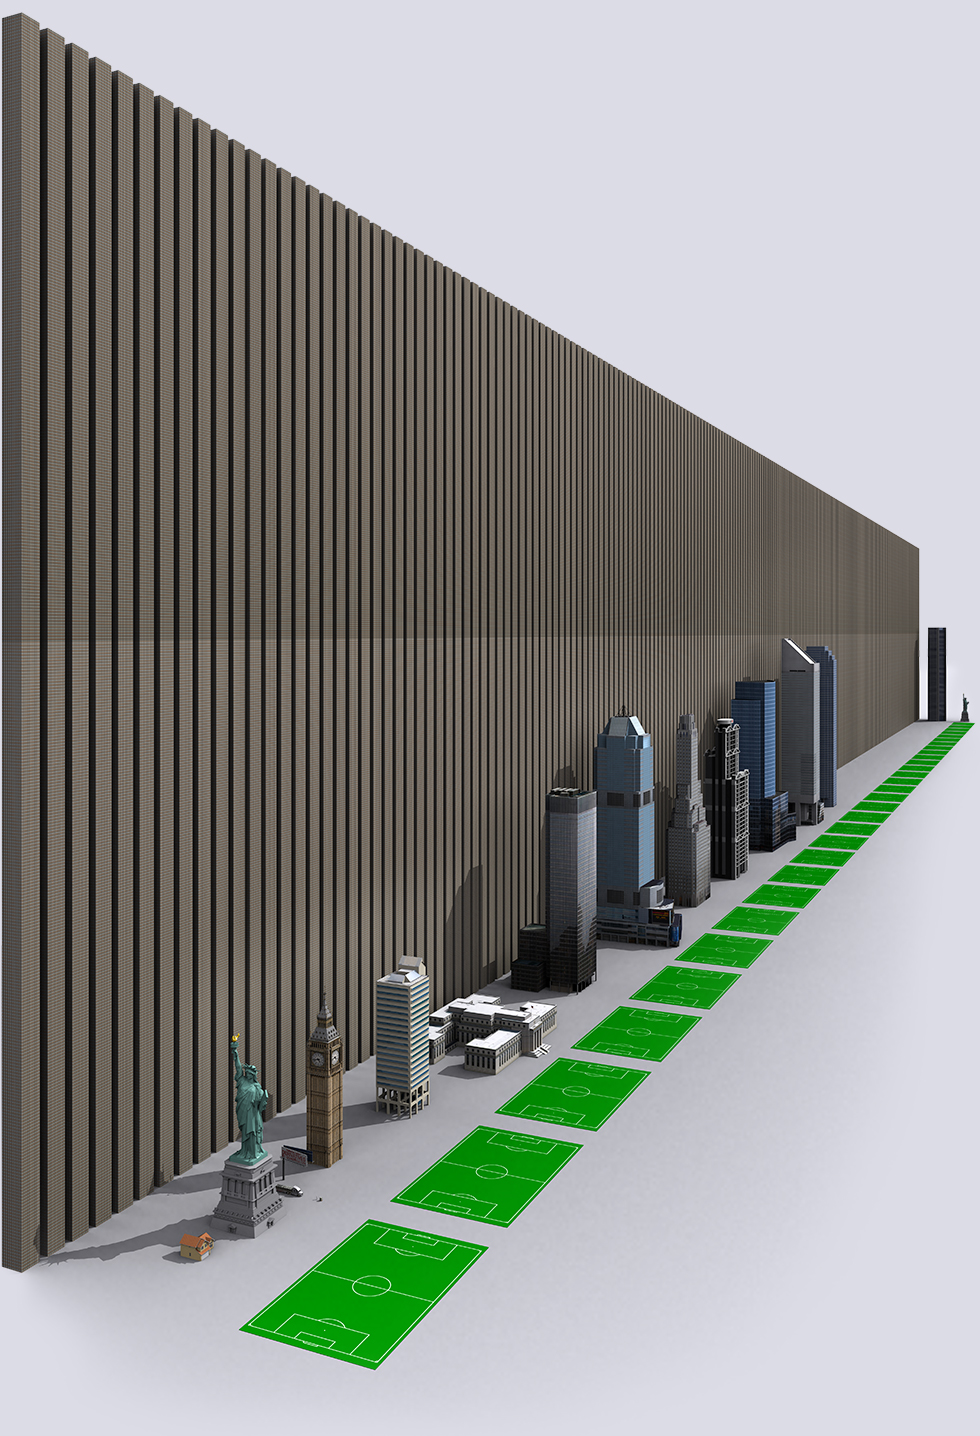
| $1 Quadrillion - Value of all Derivatives in the World | |
| This shows the total notional value of all the Derivatives in the World (Casino style bets in contract form, made by banks). | |
|
|
|
|
|
|
|
|
|
|
||||
| $1 Quadrillion = $1000 Trillions = $1 Million Billions or $1 Billion Millions |
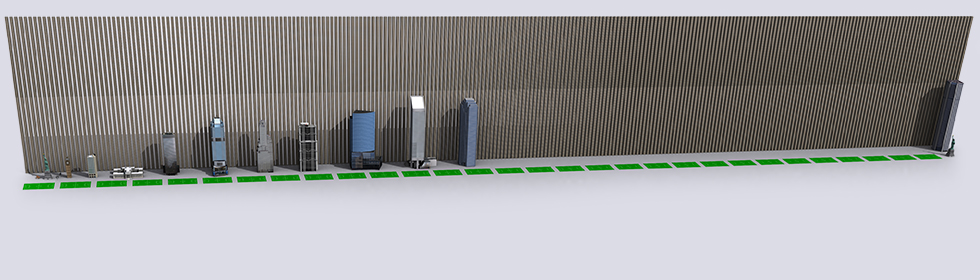
| This is another view of the Derivative Exposure cash wall. The "small" buildings are all the too-big-to-fail Bank HQ's. One wonders how the Derivative Wall would look physically in this graphic if Fed Chairwoman Janet Yellen raised the Interest Rate to historical norms on a surprise move. Moving a F5 tornado through the Derivative Wall is the physical analogy of raising interest rate to historical norms. Something somewhere would catch fire and imagine the firestorm of $1 Quadrillion burning in a high speed tornado, with the Banks caught in the middle. Demonocracy.info wishes it had more graphical rendering power to simulate a $1 Quadrillion firestorm tornado of Derivatives. ..Maybe in the future.. |
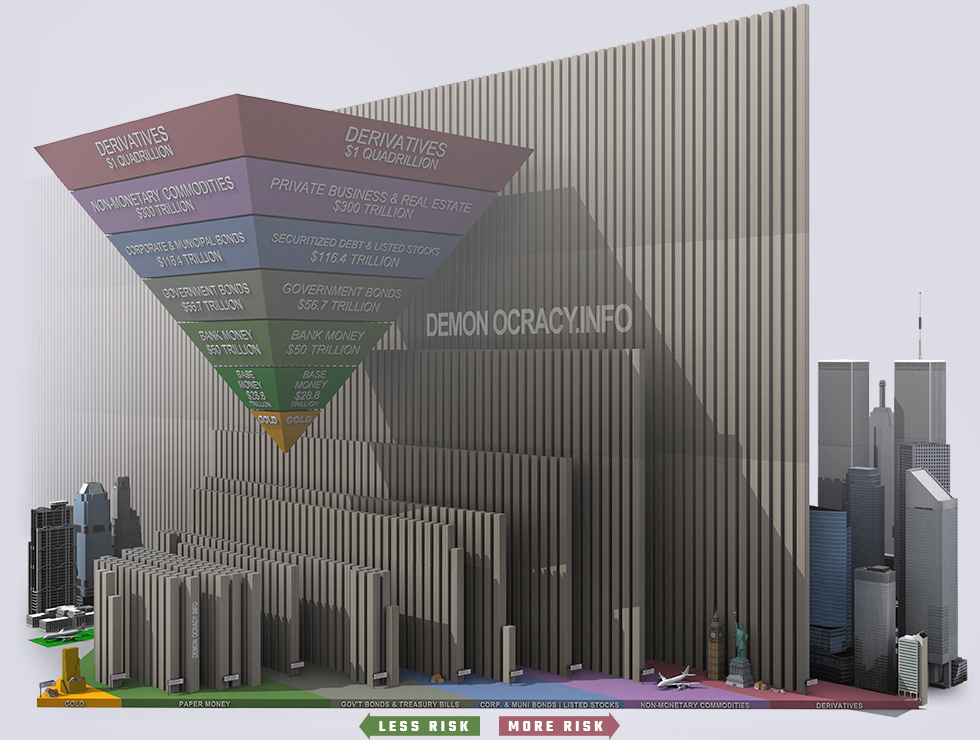
| All Money and Assets in the World shown in Physical $100 Bills |
Here we are: The Final: All the money and all the assets in the world, shown in physical cash form, in one graphic. The Liquidity Pyramid was created for visualizing the organization of asset classes in terms of risk and size. The Liquidity Pyramid was created during the time in United States, when each dollar was backed by Gold. Gold forms the small base of most reliable value, and asset classes on progressively higher levels are more risky. The larger size of asset classes at higher levels is representative of the higher total worldwide notional value of those assets. While Exter's original pyramid placed Third World debt at the top, today derivatives hold this dubious honor. As financial risk increases, money tends to move from the more risky assets (Derivatives), |
| The Liquidity Pyramid | Exter's Inverted Pyramid |
The little yellow rectangle on the left front is all the gold in the world in physical form. All the gold in the world is NOT all in "financial investment grade" form. Click on the image above for a 75 megapixel, giant resolution zoom-in eye candy bonanza! |
| More Infographics |
|
|
||||
|
|
||||
|
|
||||
|
|
||||
|
|
||||
|
|
||||
|
|
||||
|
|
||||
|
|


|
|
|
|